Introduction
In real-world DSP systems—embedded sensing, instrumentation, audio processing, vibration monitoring, and RF-adjacent pipelines—engineers routinely face narrowband tonal interference, harmonic spurs, and frequency-drifting noise components contaminating time-domain measurements.
Typical workflows rely on manual spectrum inspection and heuristic tuning: visually identifying peaks, guessing problematic frequencies, and iteratively adjusting filters until the output “looks cleaner.” While workable for simple stationary tones, this approach becomes unreliable when interference drifts over time, appears intermittently, or overlaps with broadband noise.
This article presents a deterministic and auditable workflow for spectral characterization and automated filter synthesis—focused on engineering repeatability rather than black-box optimization—and explains how SignalForge structures that pipeline end-to-end.
Deterministic in this context means that given identical input signals and configuration parameters, the pipeline produces identical tonal detection results, filter coefficients, and quantitative verification metrics—without stochastic tuning or heuristic adjustment.
Problem Summary (FAQ)
Engineers frequently ask:
- Why do PSD peaks move between measurements?
- How can drifting narrowband interference be detected reliably?
- Why does tonal noise disappear in averaged spectra but reappear in time data?
- How can false tonal detection caused by noise ripple be avoided?
- What is the best way to separate real interference from spectral artifacts?
This article addresses these problems using deterministic PSD and STFT-based analysis combined with auditable filter synthesis.
Why DSP-Based Filtering Often Fails on Real Noisy Signals
Most real-world filtering failures are not caused by filter structures themselves, but by incorrect spectral identification and non-repeatable tuning.
Common failure modes include:
- false tonal detection caused by PSD estimator variance (e.g., Welch ripple floor)
- missed interference due to frequency drift
- unstable high-Q notch placement
- excessive signal distortion
- lack of quantitative verification
A robust DSP pipeline must begin with correct spectral characterization, proceed to stable synthesis, and finish with objective performance validation.
This limitation becomes critical when filters are generated without explicit engineering constraints and quantitative verification.
For a constraint-driven engineering framework, see:
Constraint-Driven DSP Filter Design
PSD and STFT for Tonal Noise Detection in Real Signals
In many practical measurement systems, engineers frequently search for problems such as “why PSD peaks keep moving,” “false tonal detection in noisy signals,” or “how to detect drifting narrowband interference.”
These issues arise because stationary spectral methods assume fixed-frequency behavior, while real interference often drifts, appears intermittently, or is masked by broadband noise.
Combining PSD stability with STFT temporal resolution allows engineers to reliably separate true tonal components from spectral artifacts.
Power Spectral Density (PSD)
PSD reliably reveals stationary narrowband energy and remains the primary tool for detecting tonal interference.
However, PSD alone struggles when tones drift, appear intermittently, or overlap broadband noise.
Short-Time Fourier Transform (STFT)
STFT introduces temporal resolution, allowing:
- frequency drift tracking
- burst isolation
- persistent vs transient differentiation
Engineering-grade workflows combine PSD stability with STFT dynamics.
How to Detect Narrowband Interference and Harmonics in Noisy Signals
Rather than subjective tuning, deterministic characterization explicitly extracts:
- tonal frequencies
- prominence strength
- temporal persistence
- harmonic relationships
This transforms spectral inspection into structured engineering data.
Deterministic detection is most effective when combined with constraint-driven synthesis and auditable performance verification.
For a complete engineering framework, see:
Constraint-Driven DSP Filter Design
Example: One Real Signal — Analysis, Design, and Deployable Output
Below is a real SignalForge processing run showing the full deterministic pipeline—from detection to verification to firmware-ready output.
1) Tonal detection and stability diagnostics
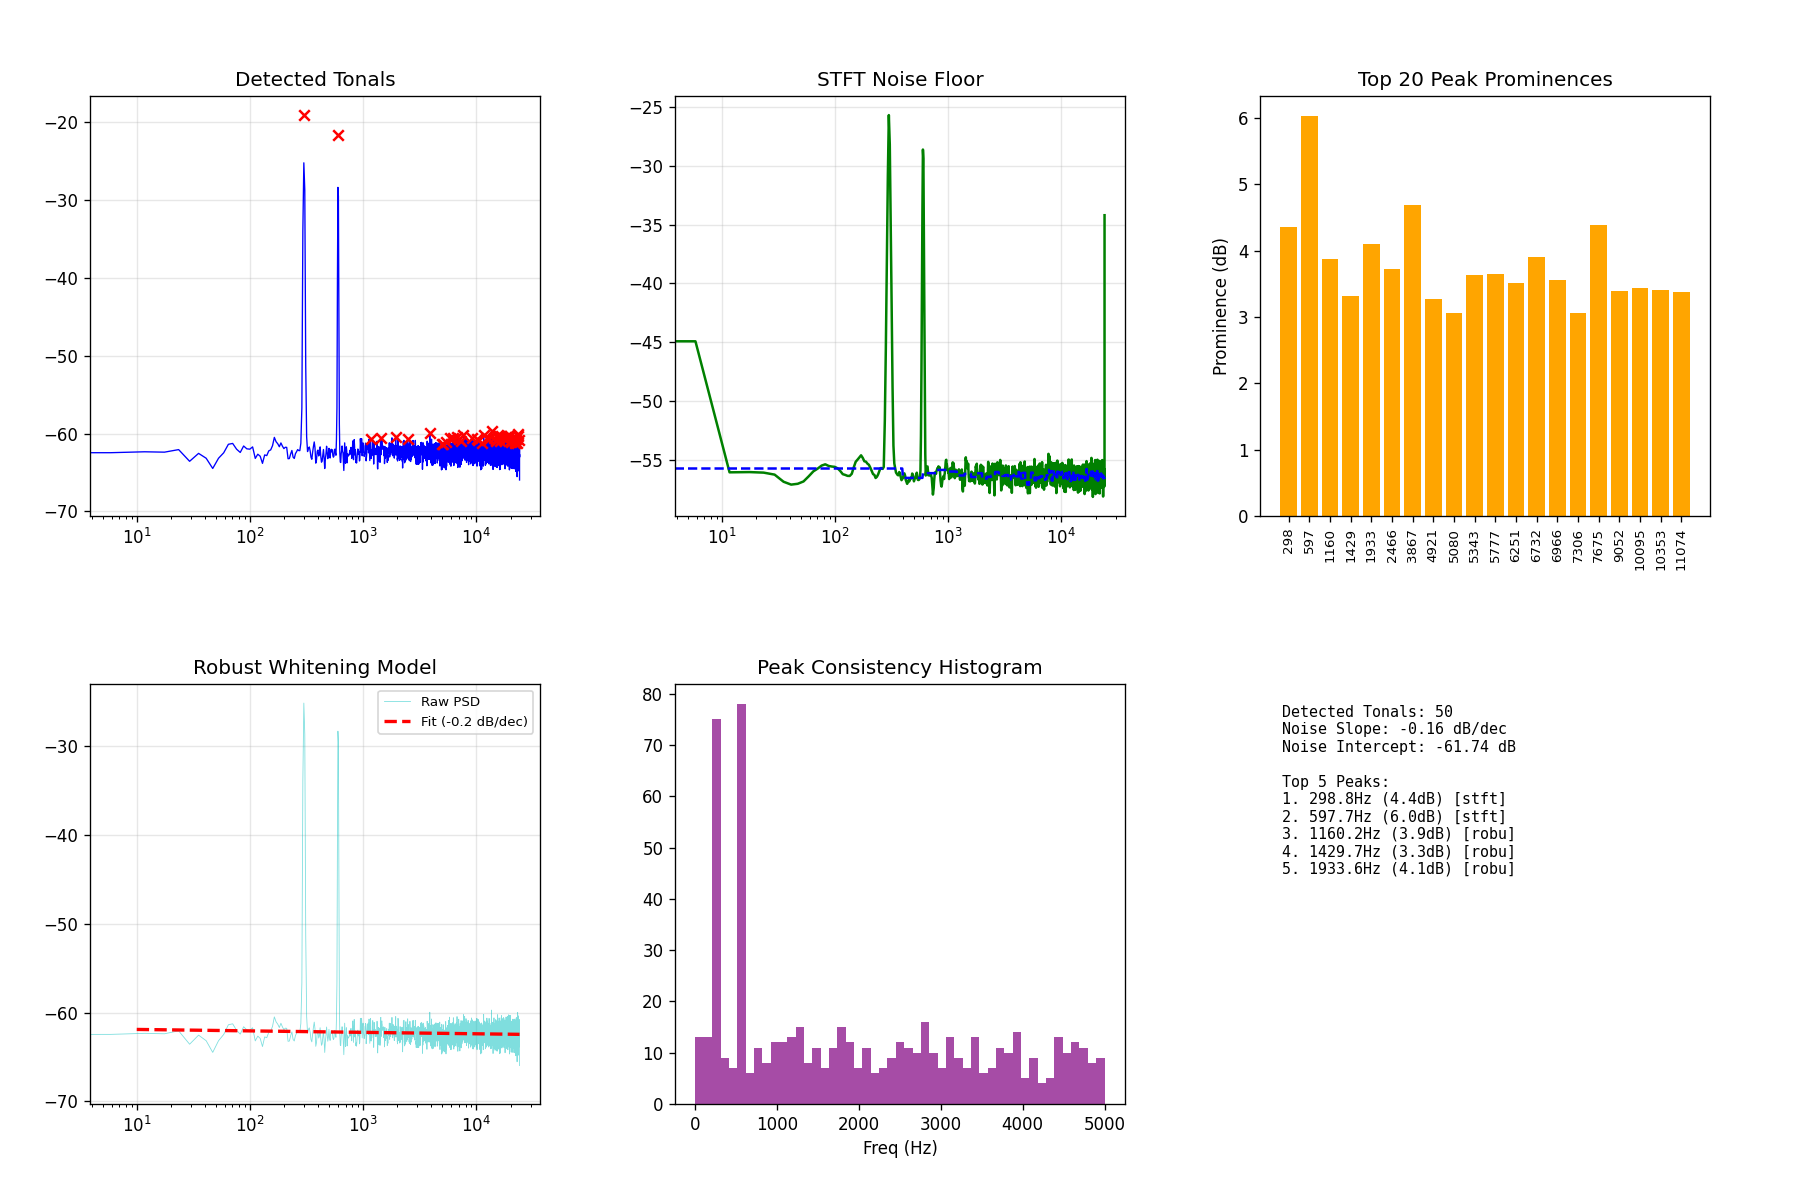
Figure 1 — PSD/STFT-based tonal peak detection with stability diagnostics preventing false notches.
2) Quantquantitative before/after verification
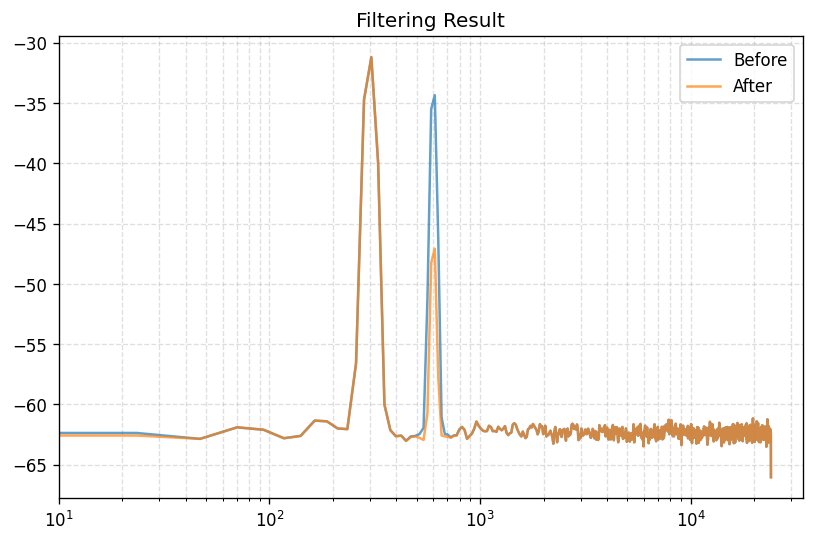
Figure 2 — Objective PSD verification demonstrating tonal suppression without broadband distortion.
3) Deployable C coefficient output
Download filter coefficients (C header):
/cases/example-b/filter_coeffs.h
#define FILTER_FS_HZ              (48000.00000000f)
#define FILTER_IIR_NUM_SECTIONS   (1u)
#define FILTER_FIR_NUM_TAPS       (101u)

static const float g_filter_iir_sos[FILTER_IIR_NUM_SECTIONS][6] =
{
    { 0.99869781f, -1.99128631f, 0.99869781f, 1.00000000f, -1.99128631f, 0.99739563f }
};